Rheology
-
class
compmod.rheology.SaintVenant(epsilon, cell, grid, dist)[source]¶ A class for parallel assembly of unit cells exhibiting time indepedent behavior. One parameter can be distributed using the cell fu
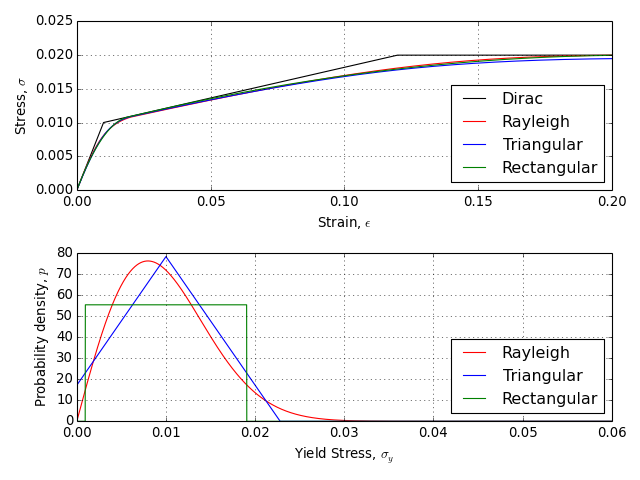
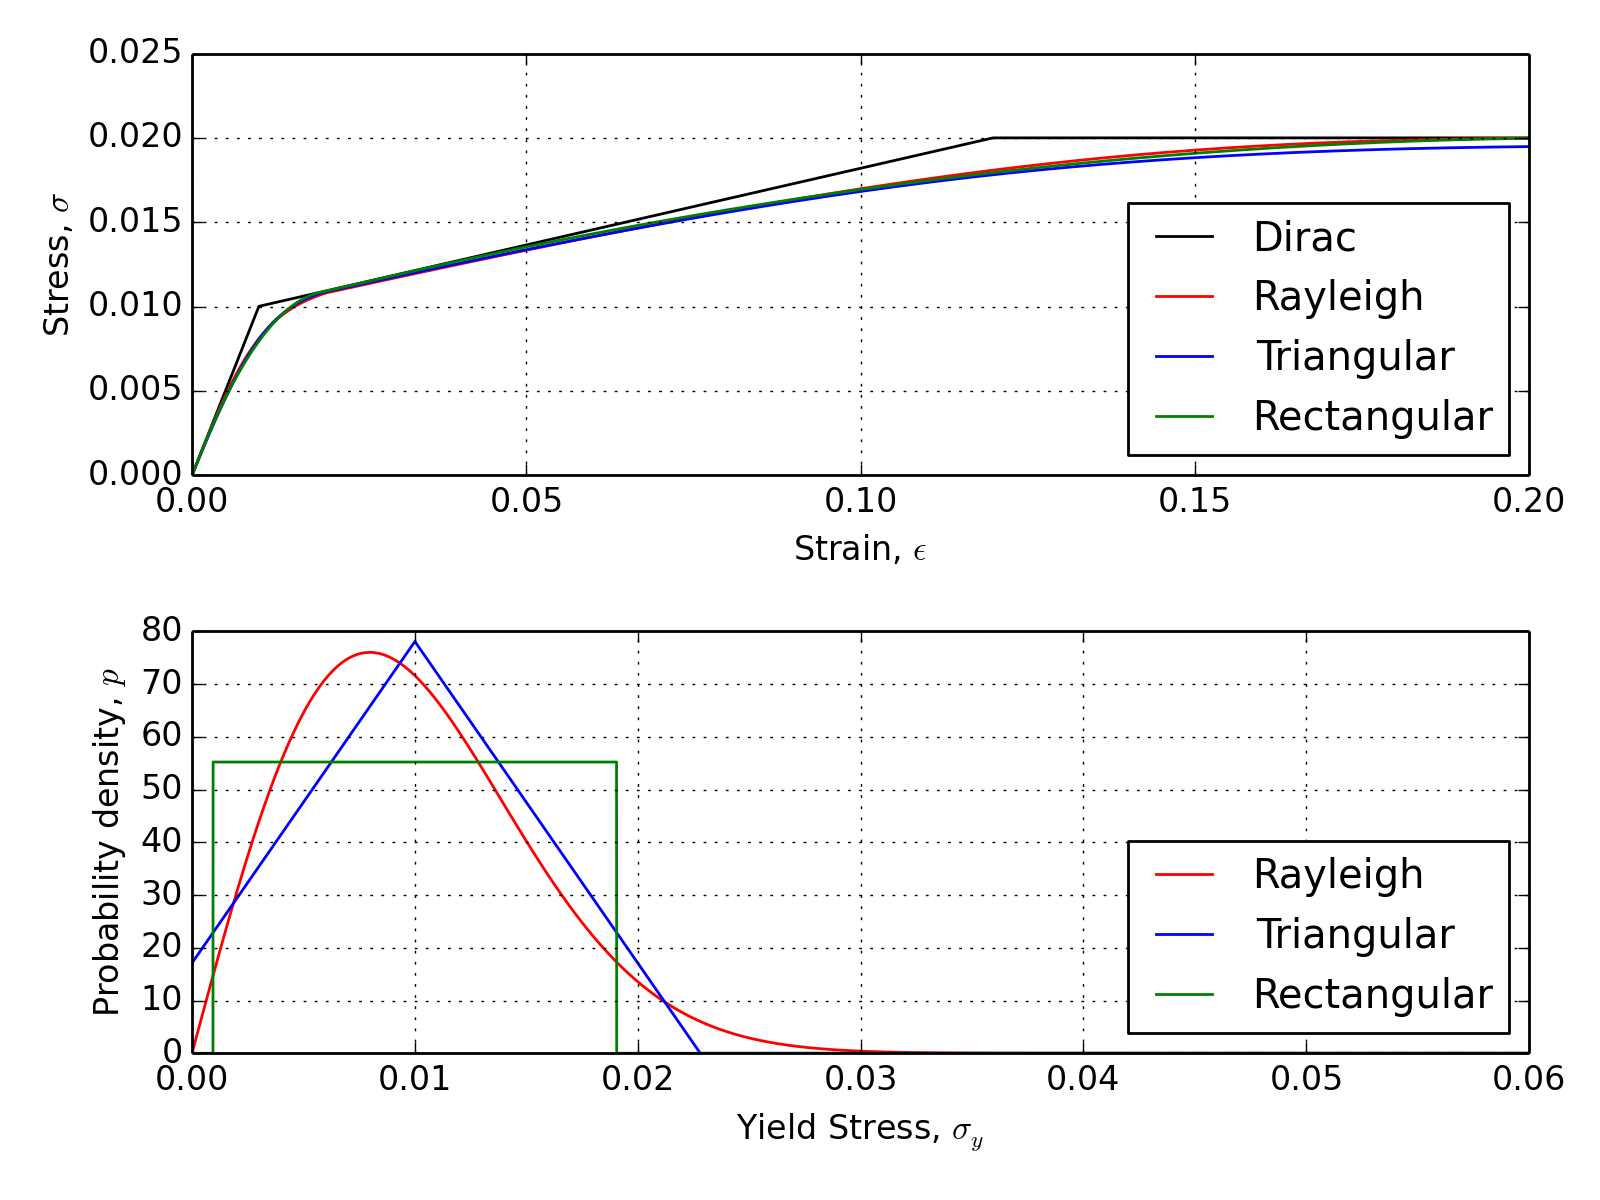
# -*- coding: utf-8 -*-
import numpy as np
import matplotlib.pyplot as plt
from compmod.distributions import Rayleigh, Triangular, Rectangular
from compmod.rheology import SaintVenant, Bilinear

E = 1.
sigmay = .01
n = .1
sigma_sat = .02
epsilon = np.linspace(0., 0.2, 1000)

sigmay_mean = sigmay
ray = Rayleigh(sigmay_mean)
std = ray.stats()[1]**.5
tri = Triangular(sigmay_mean, std)
rect = Rectangular(sigmay_mean, std)

grid = np.linspace(0., 0.06, 10000)
cell= lambda eps, sy: Bilinear(eps, E, sy, n, sigma_sat)
sigma = cell(epsilon, sigmay)
sv_ray = SaintVenant(epsilon, cell, grid, ray)
sv_tri = SaintVenant(epsilon, cell, grid, tri)
sv_rect = SaintVenant(epsilon, cell, grid, rect)

sigma_ray = sv_ray.sigma()
sigma_tri = sv_tri.sigma()
sigma_rect = sv_rect.sigma()

prob_ray = sv_ray.Dist
prob_tri = sv_tri.Dist
prob_rect = sv_rect.Dist

fig = plt.figure(0)
plt.clf()
fig.add_subplot(2,1,1)
plt.plot(epsilon, sigma, "k-", label = "Dirac")

plt.plot(epsilon, sigma_ray, 'r-', label = "Rayleigh")
plt.plot(epsilon, sigma_tri, 'b-', label = "Triangular")
plt.plot(epsilon, sigma_rect, 'g-', label = "Rectangular")
plt.legend(loc = "lower right")
plt.grid()
plt.xlabel('Strain, $\epsilon$')
plt.ylabel('Stress, $\sigma$')
fig.add_subplot(2,1,2)
plt.plot(grid, prob_ray, 'r-', label = "Rayleigh")
plt.plot(grid, prob_tri, 'b-', label = "Triangular")
plt.plot(grid, prob_rect, 'g-', label = "Rectangular")
plt.grid()
plt.xlabel('Yield Stress, $\sigma_y$')
plt.ylabel('Probability density, $p$')
plt.legend(loc = "lower right")
plt.tight_layout()
plt.show()
(Source code, png, hires.png, pdf)